RNA-Sequencing to improve characterisation and production of iPSC-induced cardiomyocytes
2020
1 Introduction
Life expectancy has drastically increased in the last century.
For instance, an infant born in 1900 could expect to live upto 32.0 years (average life expectancy in 1900 globally) and the same number is 72.6 years for an infant born in 20191.
In 1900, the top three causes of death were infectious diseases — flu (and pneumonia), tuberculosis and gastrointestinal infections2.
Enormous improvements in public health, sanitation, medical inventions and treatments such as vaccines and antibiotics led to a sharp reduction in infectious diseases which now account for less than 20% of deaths globally.
In the same time frame, there has been a significant increase in the proportion of deaths caused by more chronic, non-communicable diseases/conditions (NCD) (see Figure 1.2).
Taken together, we see an aging population strained by NCDs of which cardiovascular diseases (CVD) are the most pronounced (see Figure 1.1).
Almost half of the deaths attributed to CVDs are caused by heart failure (HF).
Despite impressive improvements in modern medicine, pharmacological interventions are capable of only alleviating the symptoms of HF, rendering it a progressive and terminal disease.
Currently, the overall survival rate at one, five and ten years after a diagnosis with heart failure is estimated to be 75.9%, 45.5% and 24.5% respectively3.
It is estimated that 1-2% of the healthcare budget is spent on HF4, while the global economic burden is estimated at $108 billion per annum5 and in Germany the annual prevalence-based costs for heart failure patients are around €25,5326.
The increasing proportions of the elderly in western societies as well as the developing nations following the trend, it is only expected that the incidence of HF would be on the rise.
Yet, this debilitating and expensive disease’s only viable treatment in terms of long-term life quality and mortality is a heart transplant.
However, as per one study7, 15% of patients died while waiting for a donor heart (at 180 days after listing), elucidating the severity of shortage of viable donor hearts.
As of February 2020, there are a total of 1082 people on the heart transplant waitlist within the EuroZone as per Eurotransplant statistics8.
Figure 1.1: Number of Deaths by Cause in the world in 2017. The graph shows the various causes of death in 2017 in the y-axis and the number of deaths per cause in the x-axis in millions. Cardiovascular diseases were responsible for most deaths (15M). Data from: Max Roser and Esteban Ortiz-Ospina (2019) – “Causes of Death”. Published online at OurWorldInData.org. Retrieved from: ‘https://ourworldindata.org/causes-of-death’ [Online Resource]
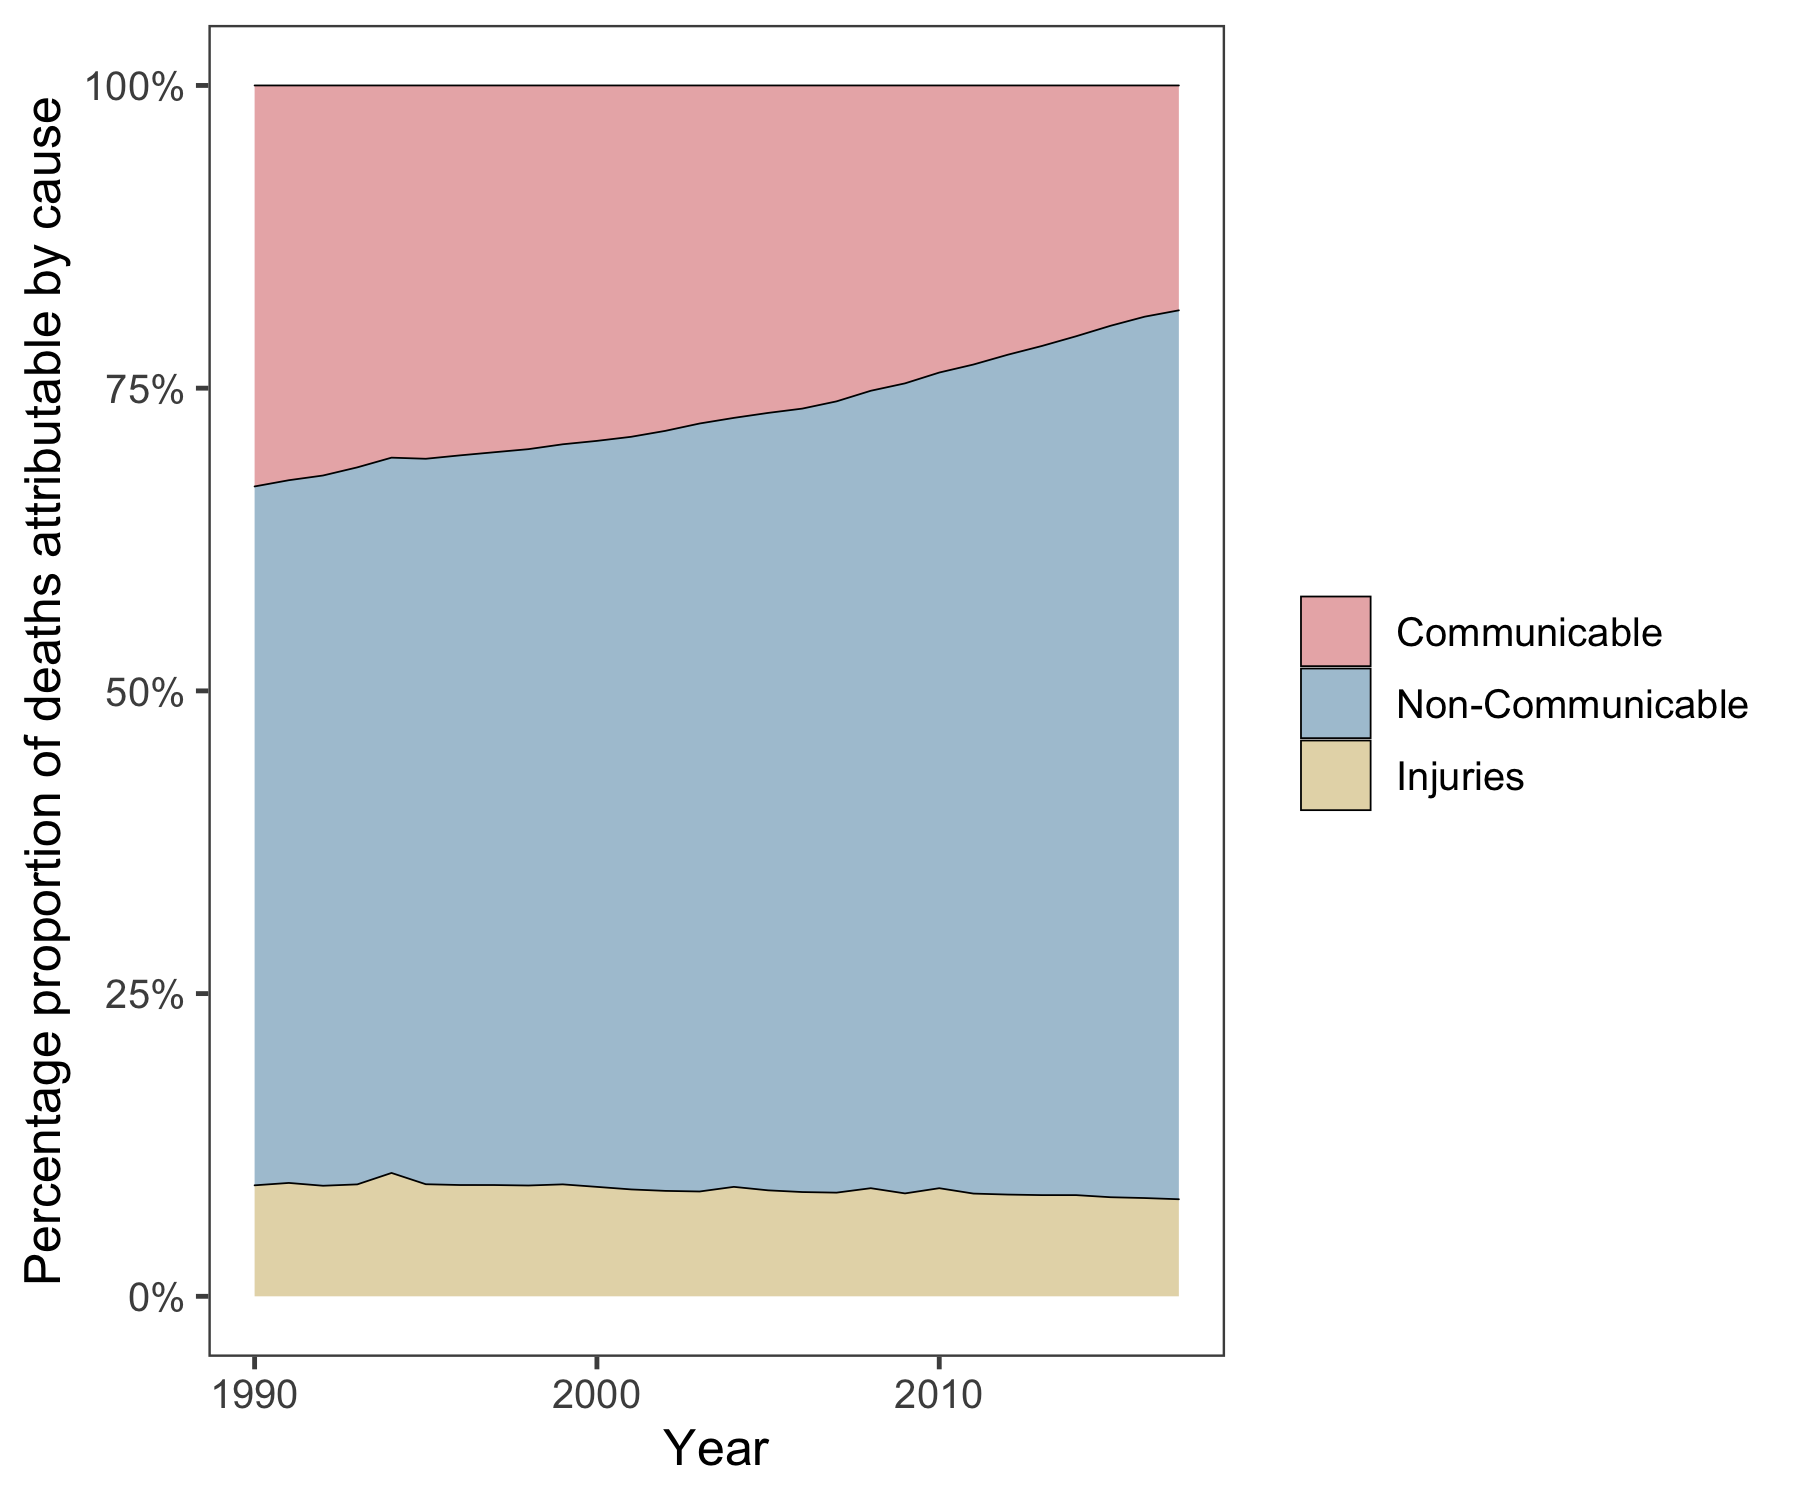
Figure 1.2: Three Major Causes of Death. Graph shows an increase in percentage proportion of deaths over the last three decades due to non-communicable diseases and a parallel reduction in deaths due to communicable diseases.
Although there are myriad causes of HF, such as isichemic heart disease, aortic or mitral regurtitation (volume stress), aortic or mitral stenosis (pressure stress), congenital cardiomyopathy, constrictive pericarditis, alcohol excess, anemia, thyrotoxicosis, septicemia, acromegaly, they all commonly operate through the central mechanism of reduced ventricular function9. Consequently, the heart is unable to adequately perfuse the tissues, resulting in a wide variety of clinical symptoms. Several compensatory measures are seen, for example, an initial phase of cardiac hypertrophy is seen to compensate for the loss of viable cardiomyocytes, resulting in a transient maintenance of the ejection fraction, sustainance of heart rate and blood pressure and thereby maintanence of organ perfusion. Over time, these remodelling mechanisms become detrimental and end up worsening the left ventricular function. In effect, a negative feed-forward pathophysiological loop governed by a dissonant neurohormonal system and imapaired calcium signalling is established in late-stage HF. Most of the pharamacological treatments currently available for HF (diuretics, beta blockers, angiotensin receptor blockers, angiotensin converting enzyme inhibitors aldosterone antagonists, etc) do not halt or address the underlying pathophysiology. Device therapies are currently the alternatives to pharmacological drugs. These include cardioverter-defibrillator (ICD) which are implanted in severe cases as a means of primary or secondary prevention of sudden cardiac death. Ventricular assist device acts as a temporary bridge to a heart transplantation. Given this current scenario, it is vital to explore novel paths for the treatment and management of HF.
1.1 Need for better therapeutics
Modern medicine has vastly improved the management of heart failure, yet it still remains a crippling disease that could immensely benefit from newer therapies. Adult human hearts are terminally differentiated and post-mitotic. A straight-forward approach in the treatment of HF would be to counteract the progressive loss of cardiomyocytes by supplementing the heart with fresh CMs10. This has been made possible largely due to the introduction of human embryonic11 and induced pluripotent stem cells 12. iPSCs are defined by their unlimited proliferation capacity and ability to differentiate into any given cell type (derivatives of all three germ layers) upon adequate stimuli. Effective and defined protocols of directed differentiation of various iPSCs to a cardiac lineage/cell fate (apart from various other cell types) have been developed and covered in the review13. The straight-forward approach of direct supplementation of CMs by an injection into the ventricular wall is fraught with its own key limitation: lack of long term engraftment of cardiomyocytes (varies based on the modality of delivery, covered below)14. Several other strategies to strenghten/remuscularize the heart such as, converting scar into muscle tissue by transdifferentiation15, inducing endogenous cardiomyocyte regeneration and proliferation16, and methods to save the remaining cardiomyocytes from cell death by modulating paracrine factors17 have been investigated (see Figure 1.3). Despite the limitation in long term engraftment, cardiomyocyte implantation remains the most plausible option from a translational and mechanisitic perspective. It is currently known that cardiomyocytes supplemented as a cell injection have the lowest retention and epicardial delivery of cardiomyocytes as tissue engineered patches show an improved retention18. Animal studies indicate that transplantation of engineered heart muscle (EHM), made from human induced pluripotent stem cells (hIPSCs), to a failing heart as a means of remuscularization showed improved cardiomyocyte proliferation, vascularization, unimpaired electrical coupling and improved left ventricular function. Additionally, these engineered patches have not shown to be associated with an increased propensity for arrhythmia19–21. More recently a macaque model of heart failure (with human-like cardiovascular physiology), showed near normal levels of contractile function after 3 months of transplantation of cardiomyocytes derived from human embryonic stem cells (hESCs)22. Collectively, these preclinical studies hold promise for the utilization of cardiomyocytes and EHMs thereby derived as a potential therapeutic source for failing human hearts.
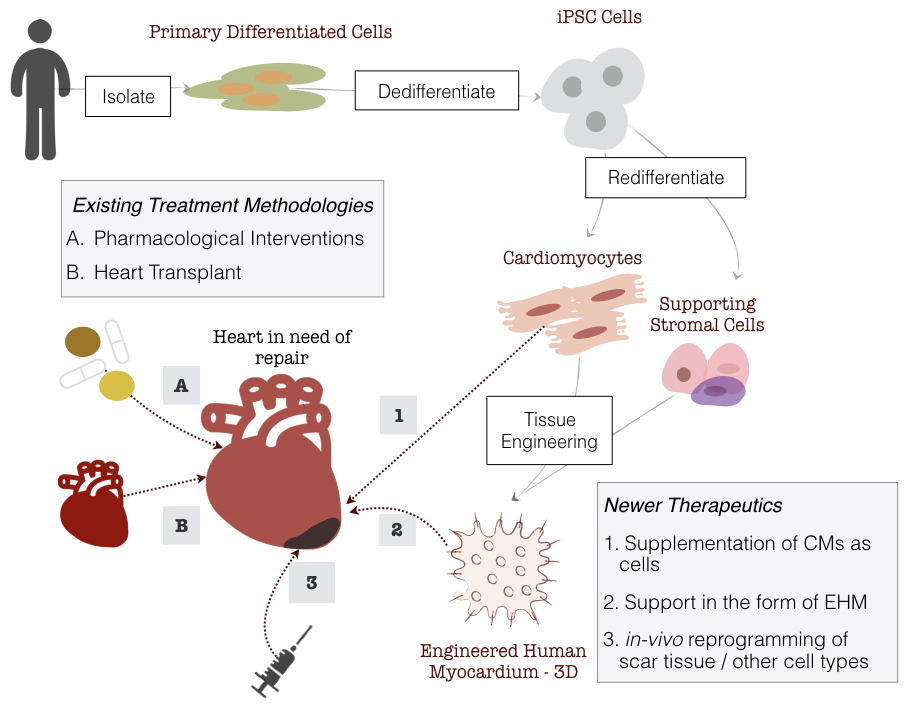
Figure 1.3: Delivery Strategies of iPSC-CMs and Treatment Options for Heart Failure. Production of EHMs start with isolating primary differentiated cells (e.g, fibroblasts) which are then dedifferentiated to iPSCs followed by redifferentiation to CMs and stromal cells, which are then combined in a collagen matrix forming the EHM.
1.1.1 Immunological Responses in Transplantations
Fully personalized cell therapy using autologous iPSCs for implantation circumvents problems associated with immune rejection. Yet, the cost and duration of obtaining clinical-grade iPSC cell lines along with their differentiation into required cell type for transplantation and verification of safety and efficacy have hampered autologous iPSC technology to move into clinical practice23,24. Allogenic transplantation1 of thoroughly characterized iPSCs seems to be a more plausible approach to cell therapy25. Histocompatibility remains the main problem of using allogenic cells and tissues, including the ones that are derived as a result of iPSC differentiation. Roughly 20,000 HLA alleles are known www.ebi.ac.uk/imgt/hla/. This polymorphism is the reason why appropriate selection of donors for transplantation is crucial and difficult. A perfect donor match is unlikely, and there is always some degree of mismatch between the recipient’s and donor’s major histocompatility complex (MHC) genes necessitating the systemic administration of immunosuppressive drugs. To circumvent these problems, an HLA-haplotype bank of pluripotent stem cell lines was proposed to establish efficiently chosen samples with sufficient HLA diversity to provide a reasonable HLA match for a large percentage of the target population26. For instance, a cell bank of 30 iPSC cell lines would enable to find a three-locus match in 82.2% of the Japanese population27. These numbers vary depending on the diversity of the population and inspite of these optimistic forecasts, such HLA haplotype banks may not completely prevent allogenic rejection as the minor mH antigens will still be inevitably different in unrelated donors and interactions of innate immunity is not accounted for28. An alternative strategy is the creation of an universal stem cell line by excision of highly polymorphic HLA class Ia and II molecules from iPSCs29. Once such cell-lines are authorized for clinical applications, using them to produce CMs and resultant EHMs would be feasible without drastic changes to the current protocols, allowing for faster and robust production of EHMs as a therapeutic option.
1.2 Engineered Human Myocardium
Engineered human myocardium is composed of human cardiomyocytes and supportive stromal cells both of which can by obtained by targeted differentiation from iPSCs using serum-free, GMP-compliant media and protocols. Differentiated cells are combined in an optimized ratio, embedded into a collagen matrix and casted (see Figure 1.4). Several EHM patches may be stacked to make a muscle layer of optimum thickness that is sutured onto a failing myocardium to assist mechanically in pumping. For translation to clinics a production protocol that is compliant with current good manufacturing practices (cGMP) is required30.
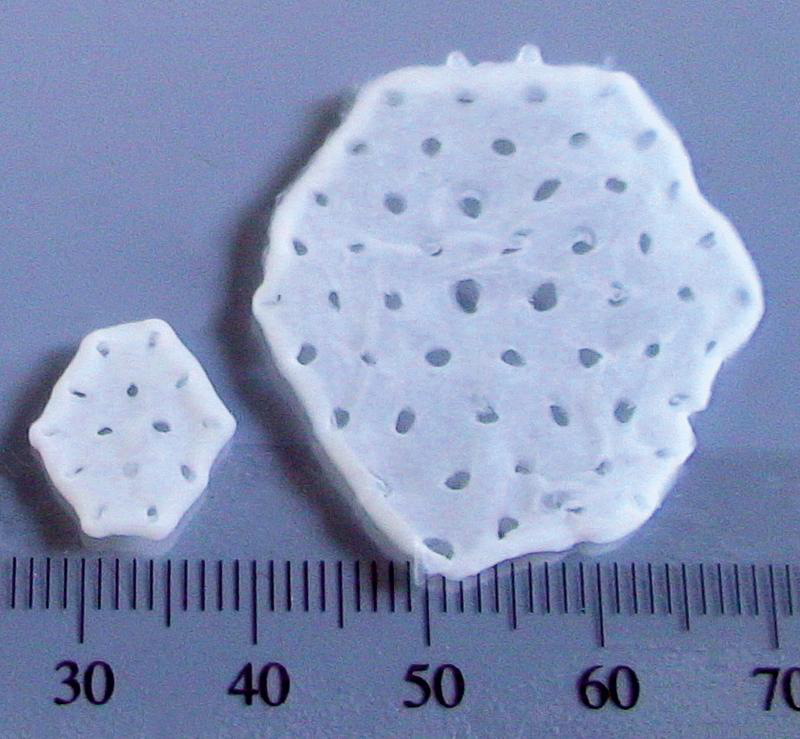
Figure 1.4: Various sizes of EHMs for clinical and experimental applications. Source: Tiburcy et al, 2017.
1.2.1 cGMP and Quality Control of Tissue Engineered Products
Tissue engineered products (TEPs) are defined as “products developed for structural and functional repair of tissue/organ defects and their mode of action is to repair, restore or replace tissue structure/function”31. Any cGMP facility accredited for the manufacturing of TEPs is designed and organized according to the Good Manufacturing Practice for Pharmaceutical Manufactures complying with their quality assurance and quality control norms, all of which fall under an established Quality System approach that regulates all aspects of the collection, processing, storage and release of cell therapy products. The Quality System approach is that of a risk-based approach and hence it is of paramount importance to reduce the risk of potential contamination, both microbiological and cross contamination with other products from the same production plant. It is for this reason the Chapters 2.6.1, 2.6.27, 2.6.12 or 2.6.13 of the European Pharmacopoeia (Ph. Eur) are dedicated to the various procedures of testing for microbial contamination that needs to be abided under a cGMP protocol32. This is because TEPs are engineered from live donor cells which can not be subjected to a sterilization process and may carry infective agents either on the cell surface or intra-cytoplasmic. They may also harbour latent infective agents integrated in the genome. The media and physical conditions used to manipulate and store the cells are by definition suited for survival and growth of certain tissues, but this could also allow for the latent and insidious growth of microbes. The methods currently in place for microbial testing involve inoculating the products in different media suitable for the growth of common aerobic and anaerobic growth of bacteria (Chapter 2.6.1 of Ph. Eur) where the growth of microbes is detected using turbidity as a measure or detected using the measure of carbon dioxide production (Chapter 2.6.27 of Ph. Eur). These are commonly known as sterility tests and although extensive, do not capture all possible bacterial contaminants that could thrive in the cellular growth media. Newer methods such as Rapid Microbiological Methods (RMM) are detection systems which yield equivalent or better results than conventional (microbiological) methods, in lesser time. In this context, an interesting possibility is to explore the potential microbial contamination using high-throughput sequencing data.
1.3 RNA Sequencing
Information stored in genes as DNA is transcribed into RNA and ultimately translated into proteins. This is the central dogma of biology. The transcription of a subset of genes into RNA molecules gives a cell it’s specificity and identity, along with regulating its activities. The term ‘Transcriptome’ refers to the total transcribed RNA at a given timepoint, whether from a population of cells or a single cell, and its analysis is known as transcriptomics. Microarrays, a hybridization based approach, were the mainstay of such transcriptomics until the recent advent of high-throughput next-generation sequencing (NGS) which revolutionized transcriptomics by enabling RNA analysis via the sequencing of complementary cDNA33. RNA sequencing (RNA-Seq) has several advantages over microarrays, namely its ability to detect transcripts that are not yet annotated, low background signal, a large dynamic range of expression level, higher sensitivity, all of which allow for understanding the dynamic and complex nature of the transcriptome.
The type of information that RNA-Seq provides can be broadly classified into two categories:
Qualitative data which includes identifying transcripts, identifying intron/extron boundaries, poly-A sites and transcriptional start sites (TSS) which in RNA-Seq terminology is commonly referred to as “annotation”.
Quantitative data which includes measuring differences in expression, alternative TSS, alternative splicing, alternative polyadenylation between two or more treatments or groups.
This power of sequencing RNA has led to RNA-Seq not only being limited to the genomics community but also to it becoming a mainstay in the toolkit of all life science research communities. A typical RNA-Seq experiment can be split into three parts34:
- Pre Analysis
- Wet-Lab (Designing the project, RNA extraction, purification and enrichment of mRNA, cDNA synthesis, fragmentation, adaptor ligation and amplification, cDNA libraries to be sequenced)
- Experimental Design (choosing the library type, sequencing legth, the number of replicates and sequencing depth). In the most common use-case of RNA-Seq analysis which is differential expression studies, two or more groups / conditions are defined. In this project, each differentiation run that produced CMs from iPSCs can be considered as a separate group.
- Sequencing Design (spike-ins, randomization at library prep, randomization at sequencing run)
- Quality Control (raw reads, read alignment, quantification, reproducibility)
- Core Analysis
- Transcriptomic Profiling (read alignment, transcript discovery, quantification level, quantification measure)
- Normalization (Z-scale, variance stabilized transformation, etc)
- Differential Expression Analysis
- Advanced Analysis
- Interpretation (functional profiling)
- Visualization
- Integration (eQTL, ATAC-seq, ChIP-Seq, proteomics/metabolomics)
The success of an RNA-Seq study depends on the choices and decisions made at each of these steps.
1.3.1 Single cell versus bulk RNA Seq
A single mammalian cell contains typically less than 1pg or 400K molecules of mRNA. The RNA to be sequenced may be collected from samples containing either multiple (bulk) or single cells. Data obtained from the more established bulk sequencing represents the average expression level for each gene across the large population of input. This bulk RNA-Seq which is the main work horse of gene expression studies is adequate for comparative transcriptomics, wherein samples of the same tissue are compared across species, or for quantifying expression signatures from ensembles, such as in disease studies. However, it falls short in its ability to be an effective tool for studying heterogeneous systems, such as complex tissues (brain, heart, etc) or early developmental studies. It also fails to capture the stochastic nature of gene expression and spatial resolution can not be obtained, as ilustrated in 1.5.
Single-cell RNA-Seq (scRNA-seq) addressess these issues as it measures the distribution of expression levels for each gene across a population of cells35. Even in diseases such as cystic fibrosis, which was considered to be well-studied and all potential cell types involved were known, scRNA-seq has revealed a new and unkown cell type, the ionocyte36. Spatially resolved scRNA-Seq holds similar promises, revealing novel information on the extent of fetal marker gene expression in small populations of adult heart tissues37. Thus, novel biological questions addressing cell type identification, heterogeneity of cell responses, stochasticity of gene expression and inference of gene regulatory networks across cells can be studied. The applications of scRNA-Seq to novel biological questions and the computational and laboratory methods catering to it are advancing at such a rapid pace that even recent reviews38,39 are becoming outdated.
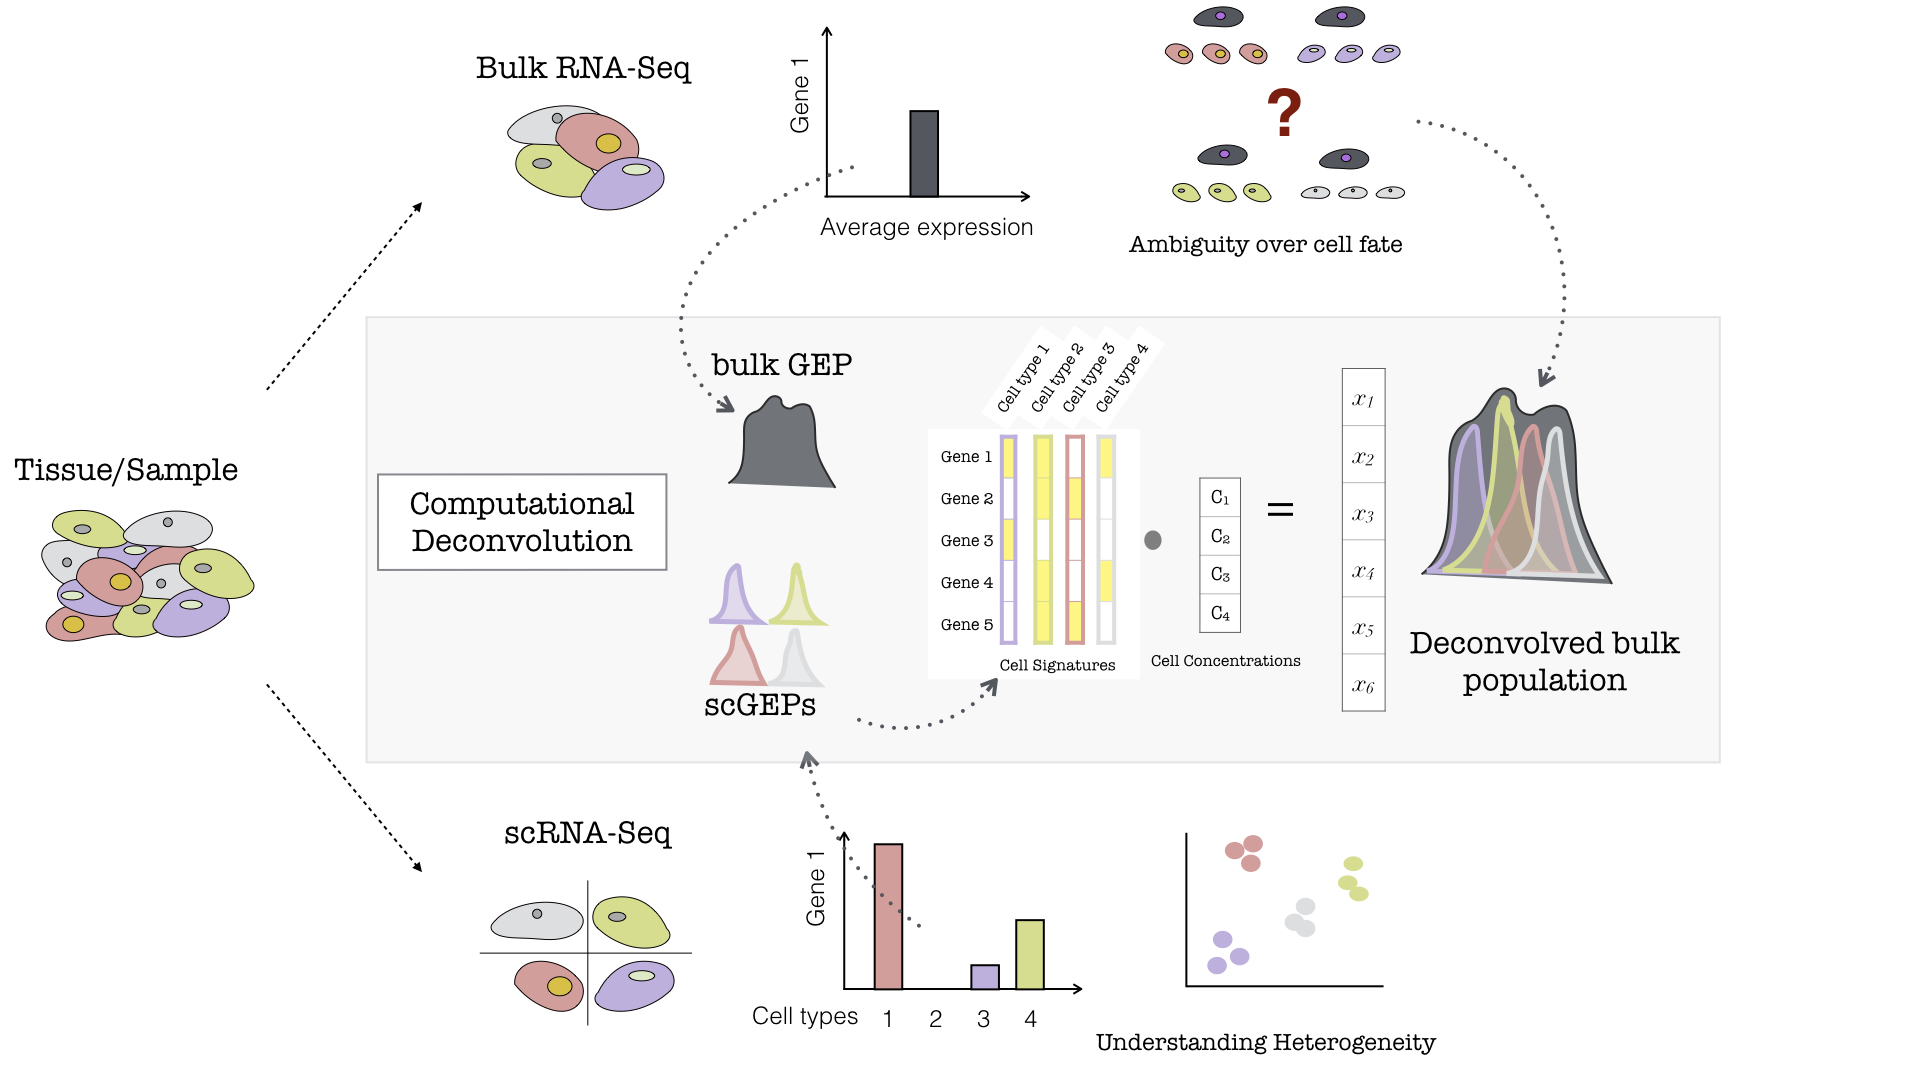
Figure 1.5: Example of Bulk and Single-Cell RNA-Seq. If a population of cells or tissue is considered, it can be sequenced either at the population/bulk level or the single-cell level (For simplicity, different coloured cells represent different sub-populations/cell-types within the sample). If the bulk analysis pathway is chosen, post-sequencing, for any arbitrary gene (here denoted as Gene 1), a single average expression level is measured, and subsequently is representative of a mixed cell population (a grey cell — combination of all the colored cells). On the otherhand, if the same population were to be sequenced using Single-Cell technologies, then each of these hypothetical cell types would record its own level of gene expression for the same arbitrary Gene 1, and this would allow to better understand the heterogenous tissue. Illustration of Computational Deconvolution in the inner grey box. Based on the type of sequencing there is either a bulk gene expression profile for the entire population (a single grey profile) or distinct single cell profiles (shown by different coloured peaks accounting for the different cell types). The single cell profiles can be used to make a cell signature matrix wherein distinct set of genes are expressed by different cell types (a simplistic example of 5 genes and 4 cell types is shown). The idea of deconvolution is that with a signature matrix and a bulk GEP, the putative proportions of cell types within the bulk sample (denoted as cell concentrations) can be estimated, given that the scRNA-Seq is representative of the population of the Bulk RNA-Seq
1.4 Computational deconvolution
The usage of scRNA-Seq is still limited by its cost and impracticality with respect to analyses of large sample cohorts. Also, most clinical specimens are fixed, for example in formalin or embedded in paraffin, which renders its dissociation into intact single-cells impossible. To circumvent these limitations and utilize the specificity and accuracy of scRNA-Seq along with the ease of bulk of RNA-Seq, several groups have developed deconvolution computational techniques40–46. Deconvolution, in the realm of sequencing, is a common umbrella term for a procedure that estimates the proportion of each cell type in a bulk sample. Flow cytometry and scRNA-Seq are experimental methods of deconvolution. Computational deconvolution leverages scRNA-Seq reference sets (or fluorescence-activated cell sorting (FACS)-sorted, purified bulk sets) for bulk gene expression deconvolution. Of various tools developed to perform deconvolution, CIBERSORTx47 became probably the most versatile because unlike other methods it can:
- Leverage scRNA-Seq derived reference profiles for bulk tissue dissection
- Overcome technical variation arising from different platforms (eg., bulk RNA-Seq, scRNA-Seq, microarrays) and tissue preservation techniques
- Digitally “purify” cell-type specific expression profiles from bulk tissues without physical cell isolation. Briefly, most deconvolution algorithms, including CIBERSORTx, work to solve the following linear equations for f: \[m = Hf\]
m: mixture gene expression profile (GEP) (to be deconvolved)
f: a vector of fraction of each cell type in a signature matrix (the unknown)
H: a signature matrix containing signature genes for cell subsets of interest
Both m and H are input requirements. Further explanation of deconvolution and the implementaion of the algorithms can be found at47,48.
With this framework, a relevant single-cell or bulk-sorted RNA sequencing data can be used to tease out molecular signatures of distinct cell types and these signatures can then be used to characterize cellular heterogeneity from bulk tissue transcriptomes without physical cell isolation, see 1.5.
1.5 Exploratory Data Analysis in RNA-Sequencing
High-throughput gene expression technologies have become a common choice for addressing systems-level and as well as molecular questions of biological phenomena. Yet, these approaches do not always meet the high expectations of the sequencing revolution, possibly due to the fact that the interpretation of the data is often lagging behind its generation. As discussed by Hudson et al.,49 in their opinion article, the rampant usage of small/curated lists of differentially expressed (DE) genes are limiting and can possibly lead to misinterpretation or out-of-context conclusions. Unbiased exploratory data analysis techniques requir holistic interpretation of the data. Common techniques include unsupervised clustering (hierarchical, k-means, etc) and dimension reduction (discussed below), which are used to detect unbiased/unpredicted patterns, confounding variables.2 Exploratory data analysis not only helps to find new ways of answering questions but it ultimately permits to detect unexpected patterns and formulate novel working hypotheses.
1.5.1 Principal Component Analysis (PCA)
High-dimensional data are common in today’s biology as they arise when several features, like the expression of many genes, are measured for multiple samples. This kind of data holds several challenges such as high computational demand and an increased error rate due to multiple test corrections when testing each feature for association with an outcome. PCA is an unsupervised dimension reduction technique, that on any given dataset performs linear transformation and fits the data to a new coordinate system in such a way that maximum variance is explained by the first coordinate, and each subsequent coordinate is orthogonal to the last and explains progressively lesser variance. Each principal component (PC) thus sums up a certain percentage of the total variation in the dataset. In this way, a set of x correlated variables over y samples is transformed to a set of p uncorrelated principal components over the same samples. Where many variables correlate with one another, they contribute strongly to the same principal component. PCA can find patters without prior knowledge about whether samples come from different treatment groups or have phenotypic differences. The first few principal components lend themselves to low-dimensional representation (eg, bi-plot) of the data, while retaining as much information as possible as they represent a large portion of the relevant information in the dataset while uncorrelated noise is pushed to the last components. An example of the application of this method can be found in Witteveen et al.’s article50. The authors performed an observational study aiming to investigate the value of early systemic inflammation in predicting ICU-acquired weakness. Systemic inflammation can be represented by a variety of inflammatory cytokines such as interleukin (IL)-6, IL-8, IL-10, IL-13, tumor necrosis factor and interferon gamma. These cytokines are correlated with each other, and incorporation of them into a regression model will result in significant collinearity. One type of cytokine is regarded as one dimension, and there are dozens of dimensions in the original dataset. In the study, the authors employed PCA to reduce the dimension. They found that the variance of these ten cytokines can be accounted for by three PCs. As a result, the model was remarkably simplified. The goal is to reduce the features’ dimensionality with minimal loss of information, for a simplistic example see Figure 1.6.
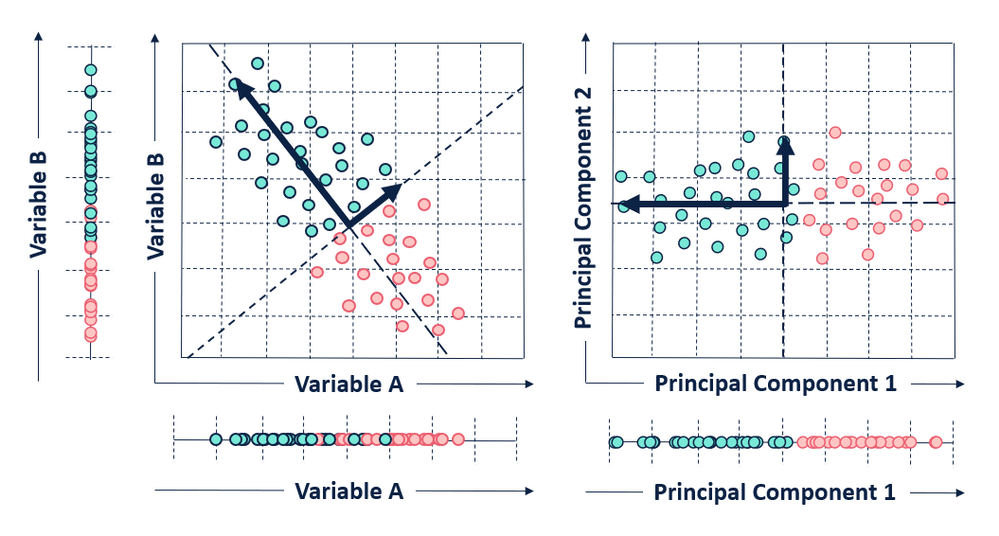
Figure 1.6: Illustration of PCA. Given two variables A and B, the plot on the left shows a scatter plot in its original place while the one on the right shows a PCA bi-plot of the variables. In this simplistic example, a 2D object (with 2 variables) which was not efficiently separated in 1D representation its original space is separated clearly in 1D across it’s first PC. Here, 2D is efficiently reduced to 1D with minimal loss of information, this same technique can be applied to several dimensions to efficiently reduce it to smaller dimensions and be easily visualized.
1.6 Rationale for the current work
Targeted differentiation of hypoimmunogenic iPSCs into functional cell types and subsequent assembly into artificial tissues for organ repair and replacement holds great potential to overcome the current donor organ shortage. Translation into clinics requires rigorous control and constant refinement of all processes involved. RNA sequencing offers an in-depth view into the state of a cell (scRNA-seq) or a cell population (bulk RNA-Seq), and is ideally suited to describe the evolution of iPSCs along transient, morphologically not fully characterized states towards a terminally differentiated cell. The two other areas relevant to this project, namely, fundamental knowledge about differentiation and refinement of differentiation protocols, have been vastly improved by the usage of sequencing technologies13,51–55. Wu et al56,57 for instance, evaluated current protocols to generate kidney organoids from hiPSCs (as source for tissue replacement) using scRNA-Seq. The study showed that the organoid-derived cell types were immature, and contained a significant percentage of non-renal cells. This proof-of-concept study showed the power of scRNA-Seq technologies to characterize and improve organoid differentiation. Prof. Zimmermann’s research group has developed GMP compliant protocols for the differentiation of hiPSC to cardiomyocytes and stromal cells which are then used to make EHMs intended for tissue replacement therapy. Currently scRNA-Seq is not available but multiple bulk RNA-Seq data across several differentiation runs have been performed by the group. The availability of bulk RNA-Seq data and public reference scRNA-Seq data sets like that of Friedman et al58 along with accessible deconvolution techniques, like CIBERSORTx, allows within the project to characterize hiPSC induced cardiomyocytes and EHM at a sub-population level based on transcriptomic data.
References
1. Max Roser, E. O.-O. & Ritchie, H. Life expectancy. Our World in Data (2020).
2. Ritchie, H. & Roser, M. Causes of death. Our World in Data (2020).
3. Taylor, C. J. et al. Trends in survival after a diagnosis of heart failure in the United Kingdom 2000-2017: Population based cohort study. BMJ 364, (2019).
4. Liao, L., Allen, L. A. & Whellan, D. J. Economic burden of heart failure in the elderly. PharmacoEconomics 26, 447–462 (2008).
5. Cook, C., Cole, G., Asaria, P., Jabbour, R. & Francis, D. P. The annual global economic burden of heart failure. International Journal of Cardiology 171, 368–376 (2014).
6. Lesyuk, W., Kriza, C. & Kolominsky-Rabas, P. Cost-of-illness studies in heart failure: A systematic review 20042016. BMC Cardiovascular Disorders 18, 74 (2018).
7. Trivedi, J. R. et al. (574) - Risk Factors of Waiting List Mortality for Patients Awaiting Heart Transplant. The Journal of Heart and Lung Transplantation 35, S214 (2016).
8. Eurotransplant - Statistics.
9. Metra, M. & Teerlink, J. R. Heart failure. The Lancet 390, 1981–1995 (2017).
10. Bergmann, O. et al. Dynamics of Cell Generation and Turnover in the Human Heart. Cell 161, 1566–1575 (2015).
11. Thomson, J. A. et al. Embryonic stem cell lines derived from human blastocysts. Science (New York, N.Y.) 282, 1145–1147 (1998).
12. Takahashi, K. et al. Induction of pluripotent stem cells from adult human fibroblasts by defined factors. Cell 131, 861–872 (2007).
13. Burridge, P. W., Keller, G., Gold, J. D. & Wu, J. C. Production of de novo cardiomyocytes: Human pluripotent stem cell differentiation and direct reprogramming. Cell Stem Cell 10, 16–28 (2012).
14. Nguyen, P. K., Neofytou, E., Rhee, J.-W. & Wu, J. C. Potential Strategies to Address the Major Clinical Barriers Facing Stem Cell Regenerative Therapy for Cardiovascular Disease: A Review. JAMA cardiology 1, 953–962 (2016).
15. Inagawa, K. & Ieda, M. Direct reprogramming of mouse fibroblasts into cardiac myocytes. Journal of Cardiovascular Translational Research 6, 37–45 (2013).
16. Kubin, T. et al. Oncostatin M is a major mediator of cardiomyocyte dedifferentiation and remodeling. Cell Stem Cell 9, 420–432 (2011).
17. Gnecchi, M. et al. Paracrine action accounts for marked protection of ischemic heart by Akt-modified mesenchymal stem cells. Nature Medicine 11, 367–368 (2005).
18. Sekine, H. et al. Cardiac cell sheet transplantation improves damaged heart function via superior cell survival in comparison with dissociated cell injection. Tissue Engineering. Part A 17, 2973–2980 (2011).
19. Weinberger, F. et al. Cardiac repair in guinea pigs with human engineered heart tissue from induced pluripotent stem cells. Science Translational Medicine 8, 363ra148 (2016).
21. Zimmermann, W.-H. et al. Engineered heart tissue grafts improve systolic and diastolic function in infarcted rat hearts. Nature Medicine 12, 452–458 (2006).
22. Liu, Y.-W. et al. Human embryonic stem cell-derived cardiomyocytes restore function in infarcted hearts of non-human primates. Nature Biotechnology 36, 597–605 (2018).
23. Neofytou, E., O’Brien, C. G., Couture, L. A. & Wu, J. C. Hurdles to clinical translation of human induced pluripotent stem cells. The Journal of Clinical Investigation 125, 2551–2557 (2015).
24. Sayed, N., Liu, C. & Wu, J. C. Translation of Human-Induced Pluripotent Stem Cells: From Clinical Trial in a Dish to Precision Medicine. Journal of the American College of Cardiology 67, 2161–2176 (2016).
25. Martin, U. Therapeutic Application of Pluripotent Stem Cells: Challenges and Risks. Frontiers in Medicine 4, (2017).
26. Taylor, C. J. et al. Banking on human embryonic stem cells: Estimating the number of donor cell lines needed for HLA matching. The Lancet 366, 2019–2025 (2005).
27. Nakatsuji, N., Nakajima, F. & Tokunaga, K. HLA-haplotype banking and iPS cells. Nature Biotechnology 26, 739–740 (2008).
28. Bogomiakova, M. E., Eremeev, A. V. & Lagarkova, M. A. At Home among Strangers: Is It Possible to Create Hypoimmunogenic Pluripotent Stem Cell Lines? Molecular Biology 53, 638–652 (2019).
29. Han, X. et al. Generation of hypoimmunogenic human pluripotent stem cells. Proceedings of the National Academy of Sciences 116, 10441–10446 (2019).
30. Tiburcy, M. et al. Defined Engineered Human Myocardium with Advanced Maturation for Applications in Heart Failure Modelling and Repair. Circulation 135, 1832–1847 (2017).
31. 2006, E. EMEA/chmp 2006. Guideline on human cell-based medicinal products. EMEA/chmp/410869/2006. (2006).
32. CD-P-TO. Guideline to the quality and safety of tissues and cells for human applications. European Committee on Organ Transplantation,EDQM (2017).
33. Wang, Z., Gerstein, M. & Snyder, M. RNA-Seq: A revolutionary tool for transcriptomics. Nature reviews. Genetics 10, 57–63 (2009).
34. Conesa, A. et al. A survey of best practices for RNA-seq data analysis. Genome Biology 17, 13 (2016).
35. Tang, F. et al. mRNA-Seq whole-transcriptome analysis of a single cell. Nature Methods 6, 377–382 (2009).
36. Montoro, D. T. et al. A revised airway epithelial hierarchy includes CFTR-expressing ionocytes. Nature 560, 319–324 (2018).
37. Asp, M. et al. Spatial detection of fetal marker genes expressed at low level in adult human heart tissue. Scientific Reports 7, (2017).
38. Stegle, O., Teichmann, S. A. & Marioni, J. C. Computational and analytical challenges in single-cell transcriptomics. Nature Reviews. Genetics 16, 133–145 (2015).
39. Svensson, V., Vento-Tormo, R. & Teichmann, S. A. Exponential scaling of single-cell RNA-seq in the past decade. Nature Protocols 13, 599–604 (2018).
40. Aran, D., Hu, Z. & Butte, A. J. xCell: Digitally portraying the tissue cellular heterogeneity landscape. Genome Biology 18, 220 (2017).
46. Shen-Orr, S. S. & Gaujoux, R. Computational deconvolution: Extracting cell type-specific information from heterogeneous samples. Current Opinion in Immunology 25, 571–578 (2013).
47. Newman, A. M. et al. Determining cell type abundance and expression from bulk tissues with digital cytometry. Nature Biotechnology 37, 773–782 (2019).
48. Chen, B., Khodadoust, M. S., Liu, C. L., Newman, A. M. & Alizadeh, A. A. Profiling tumor infiltrating immune cells with CIBERSORT. Methods in molecular biology (Clifton, N.J.) 1711, 243–259 (2018).
49. Hudson, N. J., Dalrymple, B. P. & Reverter, A. Beyond differential expression: The quest for causal mutations and effector molecules. BMC Genomics 13, 356 (2012).
50. Witteveen, E. et al. Increased Early Systemic Inflammation in ICU-Acquired Weakness; A Prospective Observational Cohort Study*. Critical Care Medicine 45, 972–979 (2017).
51. Cuomo, A. S. E. et al. Single-cell RNA-sequencing of differentiating iPS cells reveals dynamic genetic effects on gene expression. Nature Communications 11, 1–14 (2020).
55. Wesolowska-Andersen, A. et al. Analysis of Differentiation Protocols Defines a Common Pancreatic Progenitor Molecular Signature and Guides Refinement of Endocrine Differentiation. Stem Cell Reports 14, 138–153 (2020).
56. Wu, H. et al. Comparative Analysis and Refinement of Human PSC-Derived Kidney Organoid Differentiation with Single-Cell Transcriptomics. Cell Stem Cell 23, 869–881.e8 (2018).
57. Freedman, B. S. Better Being Single? Omics Improves Kidney Organoids. Nephron 141, 128–132 (2019).
58. Friedman, C. E. et al. Single-Cell Transcriptomic Analysis of Cardiac Differentiation from Human PSCs Reveals HOPX-Dependent Cardiomyocyte Maturation. Cell Stem Cell 23, 586–598.e8 (2018).
Two main types of stem cell transplants. Autologous — uses a person’s own stem cells. Allogenic — uses stem cells from an unrelated recipient.↩
A confounding variable is a variable, other than the independent variable that you’re interested in, that may affect the dependent variable. The existence of confounding variables in studies make it difficult to establish a clear causal link between treatment and outcome unless appropriate methods are used to adjust for the effect of the confounders.↩